We are going to do a walkthrough of how the log works for Connect IoT, how you can read it and configure it.
Topics
- Overview
- Default Config
- Reading the logs
Overview
Connect IoT is a back-end application, as such logging is one of the most crucial parts of understanding its execution. Logging is what brings visibility and transparency to what is happening in the application. It’s common that iot, processes a lot of information and that you need to perform some investigation in order to spot what caused an error or an unpredicted behavior. In this blog post, we will walkthrough how the log is organized and how you can read it.
Default Config
When an Automation Manager is downloaded the system comes with a default strategy and structure for logging. The template for all Automation Managers can be found in a Configuration /Cmf/System/Configuration/ConnectIoT/ConfigurationTemplate/ and can be changed for each Automation Manager in the Configuration button and editing the json.
Focusing in the subset for logging:
{
	"logging": [
		{
			"type": "Console",
			"options": {
				"level": "debug",
				"prettyPrint": true,
				"colorizeMessage": true
			},
			"applications": [
				"*"
			]
		},
		{
			"id": "ControllersAndDrivers",
			"type": "File",
			"options": {
				"filename": "${applicationName}_${date}.log",
				"dirname": "${temp}/ConnectIoT/Logs/Instances/${entityNameNormalized}/${componentId}",
				"level": "debug",
				"timestampFormat": "HH:mm:ss.SSSSS",
				"maxSize": "10m",
				"maxFiles": "30d"
			},
			"applications": [
				"AutomationController",
				"Driver*"
			]
		},
		{
			"id": "ManagerAndMonitor",
			"type": "File",
			"options": {
				"filename": "${applicationName}_${date}.log",
				"dirname": "${temp}/ConnectIoT/Logs/${applicationName}",
				"level": "debug",
				"timestampFormat": "HH:mm:ss.SSSSS",
				"maxSize": "10m",
				"maxFiles": "30d"
			},
			"applications": [
				"AutomationMonitor",
				"AutomationManager"
			]
		},
		{
			"id": "Jobs",
			"type": "File",
			"options": {
				"filename": "Job_${jobId}_${date}.log",
				"dirname": "${temp}/ConnectIoT/Jobs",
				"auditFile": "${temp}/ConnectIoT/Jobs/.audit.json",
				"level": "debug",
				"timestampFormat": "HH:mm:ss.SSSSS",
				"maxSize": "10m",
				"maxFiles": "30d"
			},
			"applications": [
				"AutomationJob"
			]
		}
	]
}
NOTE: All settings are explained in the documentation under Help Logging Structure Right away we can see that we have multiple entries that are logging different applications. Let’s go entry by entry.
{
	"logging": [
		{
			"type": "Console",
			"options": {
				"level": "debug",
				"prettyPrint": true,
				"colorizeMessage": true
			},
			"applications": [
				"*"
			]
		}
	]
}
The first entry is of type Console, this type controls what is shown when you run the Automation Manager as a console (i.e running StartConsole.bat which is included in the .zip installation package). By default, applications is * this means it will log all the existing components of ConnectIoT. In options, it is set as level debug (possible levels are debug, info, warn, error in order of verbosity), also we have prettyPrint and colorizeMessage, these are just to format the message into a more reader friendly output.
{
	"logging": [
		{
			"id": "ControllersAndDrivers",
			"type": "File",
			"options": {
				"filename": "${applicationName}_${date}.log",
				"dirname": "${temp}/ConnectIoT/Logs/Instances/${entityNameNormalized}/${componentId}",
				"level": "debug",
				"timestampFormat": "HH:mm:ss.SSSSS",
				"maxSize": "10m",
				"maxFiles": "30d"
			},
			"applications": [
				"AutomationController",
				"Driver*"
			]
		}
	]
}
We can see the second entry has more things going on. This log applies to type File, so we know this log will be persisted in a file. Now the applications are not set to everything, but this entry in the log configuration only applies to the Automation Controller and to all Driver* (notice the *, to signal all applications that start with Driver).
In the options, we now have some more interesting arguments, the dirname and filename will control the folder and file structure of the logs.
The timestampFormat is a value appended to the beginning of all log entries.
The maxSize and maxFiles are probably the most important configuration for the log. The log out of the box comes with a roll-over mechanism, in this case we can read the configuration as saying that every time a file reaches 10mb, it will generate a new file (i.e AutomationController_2023-12-06.log -> AutomationController_2023-12-06.log1), if a log is older than 30d it will be deleted as it is considered as stale. The maxFiles can define a time limit or a set number of files.
Note: Notice that we allow not only static text, but also some tokens that are replaced in runtime all tokens are documented in the help. The Normalized, can be added to perform some operations such as encoding and replacing special characters for _.
Important: The logs occupy disk space, if you are dealing with an integration that is very verbose and generates a lot of logs, keep in mind that the disk space will be proportional to what you are logging. Feel free to tweak the settings as needed.
{
	"logging": [
		{
			"id": "ManagerAndMonitor",
			"type": "File",
			"options": {
				"filename": "${applicationName}_${date}.log",
				"dirname": "${temp}/ConnectIoT/Logs/${applicationName}",
				"level": "debug",
				"timestampFormat": "HH:mm:ss.SSSSS",
				"maxSize": "10m",
				"maxFiles": "30d"
			},
			"applications": [
				"AutomationMonitor",
				"AutomationManager"
			]
		}
	]
}
The third entry is very similar to the second entry. Now we change the dirname, as the manager and monitor are not grouped by instances and we change the applications to monitor the Automation Monitor and the Automation Manager.
When generating the logs you will see a structure similar to this:
- ConnectIoT
- Logs
- Automation Manager
- (i.e AutomationManager_2023-12-06.log)
- Automation Monitor
- (i.e AutomationMonitor_2023-12-06.log)
- Instances
<Entity Name>- Controller
- (i.e AutomationController_2023-12-06.log)
<Driver FriendlyName>- (i.e DriverOpcUA_2023-12-06.log)
- Controller
- Automation Manager
- Logs
Reading the logs
Automation Manager
Let’s take a look at the beginning. This is a small snippet of the first log of the Automation Manager:
11:23:11.49149 info: Starting Manager with pid "31468".
11:23:11.49349 debug: Command line: _=[], config='..\config.json', monitorPort=0, monitor-port=0, monitorHost='', monitor-host='', monitorApplication='', monitor-application='', $0='..\src\index.js'
11:23:11.51952 debug: Monitor applications persistency data update with data from the following path "C:\Users\jroque\Downloads\ActiveTestManager\monitorApplication.json"
11:23:11.51952 debug: Using file 'C:\Users\jroque\Downloads\ActiveTestManager\config.json' for configurations
11:23:11.51952 debug: Registering configuration section 'logging' (Logging section)
11:23:11.51952 info: Parsing and validating configuration file 'C:\Users\jroque\Downloads\ActiveTestManager\config.json'
11:23:11.52052 debug: Using the following configuration settings:
Logging:
  Console (Console):
    level='debug', specificLevelLock='false', label='AutomationManager, format='${log.timestamp} ${log.level}: ${log.message}'
    timestamp='true', timestampFormat='YYYY-MM-DD HH:mm:ss.SSS', maxLength='0'
    colorize='true', colorizeMessage='true'
    applications='<All>'
  ManagerAndMonitor (File):
    level='debug', specificLevelLock='false', label='AutomationManager, format='${log.timestamp} ${log.level}: ${log.message}'
    timestamp='true', timestampFormat='HH:mm:ss.SSSSS', maxLength='0'
    dirname='C:/Users/jroque/Downloads/ActiveTestManager/ConnectIoT/Logs/AutomationManager', filename='AutomationManager_%DATE%.log', options='mode=511, flags='a''
    datePattern='YYYY-MM-DD', maxSize='10m', maxFiles='30d', zippedArchive='false'
    applications='[AutomationMonitor, AutomationManager]'
11:23:11.52252 debug: This application is not allowed to use this transport (ControllersAndDrivers)
11:23:11.54254 debug: This application is not allowed to use this transport (Jobs)
11:23:11.54254 warn: *** Minimum log entries set to 'debug' ***
11:23:11.54254 info:   Id='ActiveTestManager'.
11:23:11.54254 info:   Configuration file='C:\Users\jroque\Downloads\ActiveTestManager\config.json'.
11:23:11.54254 info:   Monitor Address='localhost:0'.
11:23:11.54354 info:   Monitor Application='C:/Users/jroque/Downloads/ActiveTestManager/ConnectIoT/Cache/[email protected]/src/index.js'.
11:23:11.54655 debug: Starting Monitor 'C:/Users/jroque/Downloads/ActiveTestManager/ConnectIoT/Cache/[email protected]/src/index.js' with args: '[--config=C:\Users\jroque\Downloads\ActiveTestManager\config.json, --id=ActiveTestManager, --dev=false]'
11:23:11.55455 info: Monitor started with pid 29084.
11:23:11.55455 info: Manager process started with success
As you can see the logs always start with timestamp the verbosity and then the log message. Right away we can see that the Automation Manager was started with pid 31468 and all the arguments used for starting the Manager. It is also explicit that the Monitor was started. These are the kinds of logs that you can expect in the Automation Manager as its main function is starting and stopping processes. The Automation Monitor and the Automation Manager logs are very useful to validate configurations and check if the boot up sequence is correct.
Automation Monitor
Looking at the Monitor. Let’s split the logs in sequential steps, so we can understand what is happening. First off the booting up sequence:
11:23:13.40440 debug: Using file 'C:\Users\jroque\Downloads\ActiveTestManager\config.json' for configurations
11:23:13.40541 debug: Registering configuration section 'logging' (Logging section)
11:23:13.40541 debug: Registering configuration section 'monitor' (Monitor Section)
11:23:13.40541 debug: Registering configuration section 'monitor/processCommunication' (Process communication for Monitor)
11:23:13.40541 debug: Registering configuration section 'repository' (Repository section)
11:23:13.40541 debug: Registering configuration section 'system' (System access section)
11:23:13.40641 info: Parsing and validating configuration file 'C:\Users\jroque\Downloads\ActiveTestManager\config.json'
11:23:13.40741 debug: Using the following configuration settings:
Logging:
  Console (Console):
    level='debug', specificLevelLock='false', label='AutomationMonitor, format='${log.timestamp} ${log.level}: ${log.message}'
    timestamp='true', timestampFormat='YYYY-MM-DD HH:mm:ss.SSS', maxLength='0'
    colorize='true', colorizeMessage='true'
    applications='<All>'
  ManagerAndMonitor (File):
    level='debug', specificLevelLock='false', label='AutomationMonitor, format='${log.timestamp} ${log.level}: ${log.message}'
    timestamp='true', timestampFormat='HH:mm:ss.SSSSS', maxLength='0'
    dirname='C:/Users/jroque/Downloads/ActiveTestManager/ConnectIoT/Logs/AutomationMonitor', filename='AutomationMonitor_%DATE%.log', options='mode=511, flags='a''
    datePattern='YYYY-MM-DD', maxSize='10m', maxFiles='30d', zippedArchive='false'
    applications='[AutomationMonitor, AutomationManager]'
Monitor:
  notifyBeforeKill='true', killNotificationTimeout='10000' ms
  retryAttempts='30', sleepBetweenAttempts='1000' ms
  processHeartbeat: isEnabled='true'
   interval='60000', timeout='10000'
   allowedFailures='3', action='Restart'
  processCommunication: useSsl='false'
Repository: type='System'
System:
  tenantName='BBRAUN', loadBalancing='false', urlSuffix='undefined'
  address='localhost', port='903', ssl='false', timeout='120000 ms'
  authentication: type='Password'
    domain='cmf', user='jroque'
11:23:13.40941 debug: This application is not allowed to use this transport (ControllersAndDrivers)
11:23:13.42743 debug: This application is not allowed to use this transport (Jobs)
11:23:13.42743 warn: *** Minimum log entries set to 'debug' ***
11:23:13.42843 info: Starting Monitor with pid "29084".
11:23:13.42843 debug: Command line: _=[], config='C:\Users\jroque\Downloads\ActiveTestManager\config.json', id='ActiveTestManager', dev='false', monitorPort=0, mp=0, monitor-port=0, monitorHost='localhost', mh='localhost', monitor-host='localhost', cache='', cd='', $0='..\ConnectIoT\Cache\[email protected]\src\index.js'
11:23:13.42943 info:   Id='ActiveTestManager'
11:23:13.42943 info:   ConfigurationFile='C:\Users\jroque\Downloads\ActiveTestManager\config.json'
11:23:13.42943 info:   HostName='localhost'
11:23:13.42943 info:   MonitorHost='localhost'
11:23:13.42943 info:   MonitorPort='0'
11:23:13.42943 info:   CacheLocation='C:/Users/jroque/Downloads/ActiveTestManager/ConnectIoT/Cache'
11:23:13.43443 info: Monitor version '10.1.2-202309224' is starting...
11:23:13.43443 debug: Setting up MES system connection
11:23:13.43443 info: Setting up SystemAPI Rest communication
11:23:13.43443 debug: tenantName='BBRAUN', loadBalancing='false', address='localhost', port='903', ssl='false'
11:23:13.43443 info: Authenticating client...
11:23:13.43443 debug: Password Authenticate: domain='cmf', username='jroque'
11:23:13.52052 info: Authentication successful for user 'CMF\jroque'
11:23:13.52553 debug: Retrieving data identified with 'httpPort'
11:23:13.52753 info: Monitor is starting on 'localhost:0'
11:23:13.52853 info: Listening websocket http address ":::64211" for driver and controller messages
11:23:13.52953 debug: Storing data for 'httpPort'
11:23:13.53053 debug: Identifying Automation Manager 'ActiveTestManager' in System
11:23:13.53053 debug: Executing query 'IdentifyAutomationManager' in System, over entity 'AutomationManager'
11:23:13.53554 info: Connected with message bus!
Notice the node process is started info: Starting Monitor with pid "29084". Then the configurations for the monitor. All boot up phases of the components are similar. It’s also clear that the monitor communicates with the MES (System) and with the MessageBus.
The next phase, it retrieves the information from the MES regarding what processes it needs to start and request to the manager to start those processes (in this case we have a controller with two drivers).
11:23:13.56156 info: Executed query, and received '1' results
11:23:13.56156 debug: Identified Automation Manager Id='2310311623180000002', Name='ActiveTestManager', MonitorPackageVersion='10.1.2-202309224'
11:23:13.56356 info: Getting list of instances (controller and driver) to monitor ('ActiveTestManager')
11:23:13.56356 debug: Executing query 'ConnectIoTGetInstancesToRun' in System, over entity 'AutomationDriverInstance'
11:23:13.56356 info: Starting process heartbeat
11:23:13.56456 info: Monitor process started with success
11:23:13.73974 info: Executed query, and received '3' results
11:23:13.74074 info: Resolving EntityType name from the Id '1805111613350000045'
11:23:13.88789 info: Resolved EntityType name 'Resource' from the Id '1805111613350000045'
11:23:13.88789 debug: Getting ObjectById: Id='2310311623180000157', Type='Resource'
11:23:14.17217 info: Resolved Object Name='ControllerTest_FleetManager_CleanRoom' from Id='2310311623180000157'
11:23:14.17217 debug: Getting ObjectById: Id='2310311623180000158', Type='Resource'
11:23:14.18118 info: Resolved Object Name='FactoryAutomationWorkerController' from Id='2310311623180000158'
11:23:14.18118 info: Preparing package '@criticalmanufacturing/connect-iot-driver-opcua', version '10.1.2-202309224'
11:23:14.18218 info: Resolving package '@criticalmanufacturing/connect-iot-driver-opcua' with version '10.1.2-202309224' location.
11:23:14.20020 info: Found package '@criticalmanufacturing/connect-iot-driver-opcua' with version '10.1.2-202309224' in 'C:\Users\jroque\Downloads\ActiveTestManager\ConnectIoT\Cache\[email protected]'
11:23:14.20020 info: Preparing package '@criticalmanufacturing/connect-iot-controller', version '10.1.2-202309224'
11:23:14.20120 info: Resolving package '@criticalmanufacturing/connect-iot-controller' with version '10.1.2-202309224' location.
11:23:14.20821 info: Found package '@criticalmanufacturing/connect-iot-controller' with version '10.1.2-202309224' in 'C:\Users\jroque\Downloads\ActiveTestManager\ConnectIoT\Cache\[email protected]'
11:23:14.20821 info: Preparing package '@criticalmanufacturing/connect-iot-driver-opcua', version '10.1.2-202309224'
11:23:14.20821 info: Resolving package '@criticalmanufacturing/connect-iot-driver-opcua' with version '10.1.2-202309224' location.
11:23:14.20921 info: Found package '@criticalmanufacturing/connect-iot-driver-opcua' with version '10.1.2-202309224' in 'C:\Users\jroque\Downloads\ActiveTestManager\ConnectIoT\Cache\[email protected]'
11:23:14.20921 info: Preparing package '@criticalmanufacturing/connect-iot-driver-factoryautomation', version '10.1.2-202309224'
11:23:14.20921 info: Resolving package '@criticalmanufacturing/connect-iot-driver-factoryautomation' with version '10.1.2-202309224' location.
11:23:14.21622 info: Found package '@criticalmanufacturing/connect-iot-driver-factoryautomation' with version '10.1.2-202309224' in 'C:\Users\jroque\Downloads\ActiveTestManager\ConnectIoT\Cache\[email protected]'
11:23:14.21622 info: Preparing package '@criticalmanufacturing/connect-iot-controller', version '10.1.2-202309224'
11:23:14.21622 info: Resolving package '@criticalmanufacturing/connect-iot-controller' with version '10.1.2-202309224' location.
11:23:14.21722 info: Found package '@criticalmanufacturing/connect-iot-controller' with version '10.1.2-202309224' in 'C:\Users\jroque\Downloads\ActiveTestManager\ConnectIoT\Cache\[email protected]'
11:23:14.21822 info: Processes to start:
11:23:14.21822 info: AutomationControllerInstance/2310311623180000011  @criticalmanufacturing/[email protected]
11:23:14.21822 info:     AutomationDriverInstance/2310311623180000032  @criticalmanufacturing/[email protected] (Server)
11:23:14.21922 info:     AutomationDriverInstance/2310311623180000033  @criticalmanufacturing/[email protected] (Client)
11:23:14.21922 info: AutomationControllerInstance/2310311623180000012  @criticalmanufacturing/[email protected]
11:23:14.21922 info:     AutomationDriverInstance/2310311623180000025  @criticalmanufacturing/[email protected] (Handler)
11:23:14.21922 info: Starting process id='AutomationDriverInstance/2310311623180000032', name='@criticalmanufacturing/connect-iot-driver-opcua', version='10.1.2-202309224'
11:23:14.21922 info: Starting 'Server' main script 'C:\Users\jroque\Downloads\ActiveTestManager\ConnectIoT\Cache\[email protected]\src\index.js'
11:23:14.22022 info: Requesting fork Id='AutomationDriverInstance/2310311623180000032', Path='C:\Users\jroque\Downloads\ActiveTestManager\ConnectIoT\Cache\[email protected]\src\index.js'
11:23:14.22022 debug:  Arguments=--id=AutomationDriverInstance/2310311623180000032 --managerId=ActiveTestManager --componentId=Server --serverHost=localhost --monitorPort=64211 --monitorHost=localhost --monitorToken=monitorSecurityToken --monitorSsl=false --config=C:\Users\jroque\Downloads\ActiveTestManager\config.json --dev=false --entityName=ControllerTest_FleetManager_CleanRoom
11:23:14.22723 info: Received notification of process 'AutomationDriverInstance/2310311623180000032' start with Pid '11724"
11:23:14.22723 info: Started process 'AutomationDriverInstance/2310311623180000032' not being handled by Monitor Pid='11724'. Message ignored?
11:23:14.22723 info: fork "C:\Users\jroque\Downloads\ActiveTestManager\ConnectIoT\Cache\[email protected]\src\index.js" succeeded with pid "11724"
11:23:14.22823 info: Starting process id='AutomationControllerInstance/2310311623180000011', name='@criticalmanufacturing/connect-iot-controller', version='10.1.2-202309224'
11:23:14.22823 info: Starting 'Controller' main script 'C:\Users\jroque\Downloads\ActiveTestManager\ConnectIoT\Cache\[email protected]\src\index.js'
11:23:14.22823 info: Requesting fork Id='AutomationControllerInstance/2310311623180000011', Path='C:\Users\jroque\Downloads\ActiveTestManager\ConnectIoT\Cache\[email protected]\src\index.js'
11:23:14.22823 debug:  Arguments=--id=AutomationControllerInstance/2310311623180000011 --managerId=ActiveTestManager --componentId=Controller --serverHost=localhost --monitorPort=64211 --monitorHost=localhost --monitorToken=monitorSecurityToken --monitorSsl=false --config=C:\Users\jroque\Downloads\ActiveTestManager\config.json --dev=false --entityName=ControllerTest_FleetManager_CleanRoom
11:23:14.23323 info: Received notification of process 'AutomationControllerInstance/2310311623180000011' start with Pid '30428"
11:23:14.23323 info: Started process 'AutomationControllerInstance/2310311623180000011' not being handled by Monitor Pid='30428'. Message ignored?
11:23:14.23423 info: fork "C:\Users\jroque\Downloads\ActiveTestManager\ConnectIoT\Cache\[email protected]\src\index.js" succeeded with pid "30428"
11:23:14.23423 info: Starting process id='AutomationDriverInstance/2310311623180000033', name='@criticalmanufacturing/connect-iot-driver-opcua', version='10.1.2-202309224'
11:23:14.23423 info: Starting 'Client' main script 'C:\Users\jroque\Downloads\ActiveTestManager\ConnectIoT\Cache\[email protected]\src\index.js'
11:23:14.23423 info: Requesting fork Id='AutomationDriverInstance/2310311623180000033', Path='C:\Users\jroque\Downloads\ActiveTestManager\ConnectIoT\Cache\[email protected]\src\index.js'
11:23:14.23423 debug:  Arguments=--id=AutomationDriverInstance/2310311623180000033 --managerId=ActiveTestManager --componentId=Client --serverHost=localhost --monitorPort=64211 --monitorHost=localhost --monitorToken=monitorSecurityToken --monitorSsl=false --config=C:\Users\jroque\Downloads\ActiveTestManager\config.json --dev=false --entityName=ControllerTest_FleetManager_CleanRoom
11:23:14.24224 info: Received notification of process 'AutomationDriverInstance/2310311623180000033' start with Pid '19324"
11:23:14.24224 info: Started process 'AutomationDriverInstance/2310311623180000033' not being handled by Monitor Pid='19324'. Message ignored?
11:23:14.24224 info: fork "C:\Users\jroque\Downloads\ActiveTestManager\ConnectIoT\Cache\[email protected]\src\index.js" succeeded with pid "19324"
11:23:14.24324 info: Starting process id='AutomationDriverInstance/2310311623180000025', name='@criticalmanufacturing/connect-iot-driver-factoryautomation', version='10.1.2-202309224'
11:23:14.24324 info: Starting 'Handler' main script 'C:\Users\jroque\Downloads\ActiveTestManager\ConnectIoT\Cache\[email protected]\src\index.js'
11:23:14.24324 info: Requesting fork Id='AutomationDriverInstance/2310311623180000025', Path='C:\Users\jroque\Downloads\ActiveTestManager\ConnectIoT\Cache\[email protected]\src\index.js'
11:23:14.24324 debug:  Arguments=--id=AutomationDriverInstance/2310311623180000025 --managerId=ActiveTestManager --componentId=Handler --serverHost=localhost --monitorPort=64211 --monitorHost=localhost --monitorToken=monitorSecurityToken --monitorSsl=false --config=C:\Users\jroque\Downloads\ActiveTestManager\config.json --dev=false --entityName=FactoryAutomationWorkerController
11:23:14.24925 info: Received notification of process 'AutomationDriverInstance/2310311623180000025' start with Pid '22304"
11:23:14.24925 info: Started process 'AutomationDriverInstance/2310311623180000025' not being handled by Monitor Pid='22304'. Message ignored?
11:23:14.25025 info: fork "C:\Users\jroque\Downloads\ActiveTestManager\ConnectIoT\Cache\[email protected]\src\index.js" succeeded with pid "22304"
11:23:14.25025 info: Starting process id='AutomationControllerInstance/2310311623180000012', name='@criticalmanufacturing/connect-iot-controller', version='10.1.2-202309224'
11:23:14.25025 info: Starting 'Controller' main script 'C:\Users\jroque\Downloads\ActiveTestManager\ConnectIoT\Cache\[email protected]\src\index.js'
11:23:14.25025 info: Requesting fork Id='AutomationControllerInstance/2310311623180000012', Path='C:\Users\jroque\Downloads\ActiveTestManager\ConnectIoT\Cache\[email protected]\src\index.js'
11:23:14.25025 debug:  Arguments=--id=AutomationControllerInstance/2310311623180000012 --managerId=ActiveTestManager --componentId=Controller --serverHost=localhost --monitorPort=64211 --monitorHost=localhost --monitorToken=monitorSecurityToken --monitorSsl=false --config=C:\Users\jroque\Downloads\ActiveTestManager\config.json --dev=false --entityName=FactoryAutomationWorkerController
11:23:14.25726 info: Received notification of process 'AutomationControllerInstance/2310311623180000012' start with Pid '4144"
11:23:14.25726 info: Started process 'AutomationControllerInstance/2310311623180000012' not being handled by Monitor Pid='4144'. Message ignored?
11:23:14.25726 info: fork "C:\Users\jroque\Downloads\ActiveTestManager\ConnectIoT\Cache\[email protected]\src\index.js" succeeded with pid "4144"
11:23:14.25826 info: Processes and packages processed
11:23:15.47447 debug: Client Connected! from 64223. Have now 1 clients.
11:23:15.48348 debug: Client Connected! from 64226. Have now 2 clients.
11:23:16.59459 debug: Client Connected! from 64232. Have now 3 clients.
11:23:16.60260 debug: Client Connected! from 64233. Have now 4 clients.
11:23:16.62462 info: Component "AutomationDriverInstance/2310311623180000032" notified it just become available
11:23:16.62963 info: Notifying 'AutomationControllerInstance/2310311623180000011' with connection information to 'AutomationDriverInstance/2310311623180000032' (Server)
11:23:16.62963 debug: Data provided: type='websocket', host='localhost', port='64235', ssl='false'
11:23:16.63163 info: Component "AutomationDriverInstance/2310311623180000033" notified it just become available
11:23:16.63263 info: Notifying 'AutomationControllerInstance/2310311623180000011' with connection information to 'AutomationDriverInstance/2310311623180000033' (Client)
11:23:16.63363 debug: Data provided: type='websocket', host='localhost', port='64234', ssl='false'
11:23:16.80080 info: Resolving package '@criticalmanufacturing/connect-iot-controller-engine-core-tasks' with version '10.1.2-202309224' location.
11:23:16.80180 info: Resolving package '@criticalmanufacturing/connect-iot-controller-engine-factoryautomation-tasks' with version '10.1.2-202309224' location.
11:23:16.80881 info: Found package '@criticalmanufacturing/connect-iot-controller-engine-core-tasks' with version '10.1.2-202309224' in 'C:\Users\jroque\Downloads\ActiveTestManager\ConnectIoT\Cache\[email protected]'
11:23:16.81782 info: Found package '@criticalmanufacturing/connect-iot-controller-engine-factoryautomation-tasks' with version '10.1.2-202309224' in 'C:\Users\jroque\Downloads\ActiveTestManager\ConnectIoT\Cache\connect-iot-controller-engine-factoryautomation-tasks@10.1.2-202309224'
11:23:17.01001 debug: Client Connected! from 64236. Have now 5 clients.
11:23:17.08509 info: Component "AutomationDriverInstance/2310311623180000025" notified it just become available
11:23:17.08609 info: Notifying 'AutomationControllerInstance/2310311623180000012' with connection information to 'AutomationDriverInstance/2310311623180000025' (Handler)
11:23:17.08609 debug: Data provided: type='websocket', host='localhost', port='64237', ssl='false'
11:23:17.55355 info: Resolving package '@criticalmanufacturing/connect-iot-controller-engine-core-tasks' with version '10.1.2-202309224' location.
11:23:17.55455 info: Found package '@criticalmanufacturing/connect-iot-controller-engine-core-tasks' with version '10.1.2-202309224' in 'C:\Users\jroque\Downloads\ActiveTestManager\ConnectIoT\Cache\[email protected]'
11:23:17.55656 info: Resolving package '@criticalmanufacturing/connect-iot-controller-engine-opcua-tasks' with version '10.1.2-202309224' location.
11:23:17.56657 info: Found package '@criticalmanufacturing/connect-iot-controller-engine-opcua-tasks' with version '10.1.2-202309224' in 'C:\Users\jroque\Downloads\ActiveTestManager\ConnectIoT\Cache\[email protected]'
11:23:18.42442 info: Component "AutomationControllerInstance/2310311623180000012" notified it just become available
11:23:18.42543 info: Notifying 'AutomationControllerInstance/2310311623180000012' with connection information to 'AutomationDriverInstance/2310311623180000025' (Handler)
11:23:18.42543 debug: Data provided: type='websocket', host='localhost', port='64237', ssl='false'
11:23:18.55055 info: Received order to 'setautomationstates' the Controller 'AutomationControllerInstance/2310311623180000012' for this AutomationManager
11:23:18.82482 info: Resolving package '@criticalmanufacturing/connect-iot-controller-engine-factoryautomation-tasks' with version '10.1.2-202309224' location.
11:23:18.82583 info: Found package '@criticalmanufacturing/connect-iot-controller-engine-factoryautomation-tasks' with version '10.1.2-202309224' in 'C:\Users\jroque\Downloads\ActiveTestManager\ConnectIoT\Cache\connect-iot-controller-engine-factoryautomation-tasks@10.1.2-202309224'
11:23:19.18519 info: Component "AutomationControllerInstance/2310311623180000011" notified it just become available
The processes to start are found in:
11:23:14.21822 info: Processes to start:
11:23:14.21822 info: AutomationControllerInstance/2310311623180000011  @criticalmanufacturing/[email protected]
11:23:14.21822 info:     AutomationDriverInstance/2310311623180000032  @criticalmanufacturing/[email protected] (Server)
11:23:14.21922 info:     AutomationDriverInstance/2310311623180000033  @criticalmanufacturing/[email protected] (Client)
11:23:14.21922 info: AutomationControllerInstance/2310311623180000012  @criticalmanufacturing/[email protected]
11:23:14.21922 info:     AutomationDriverInstance/2310311623180000025  @criticalmanufacturing/[email protected] (Handler)
Then the retrieval of all the cached packages, like for example info: Resolving package '@criticalmanufacturing/connect-iot-controller-engine-core-tasks' with version '10.1.2-202309224' location. As the components are started by the manager the monitor will log that they are now available (i.e 11:23:18.42442 info: Component "AutomationControllerInstance/2310311623180000012" notified it just become available).
Automation Controller
The Automation Controller logs all the logic in our workflows execution will be described. Everything that is orchestrated inside the workflows will be logged in this component.
11:23:15.34034 debug: Using file 'C:\Users\jroque\Downloads\ActiveTestManager\config.json' for configurations
11:23:15.34334 debug: Registering configuration section 'logging' (Logging section)
11:23:15.34334 debug: Registering configuration section 'controller' (Controller Section)
11:23:15.34334 debug: Registering configuration section 'monitor/processCommunication' (Process communication with Monitor)
11:23:15.34334 debug: Registering configuration section 'driver/processCommunication' (Process communication with Drivers)
11:23:15.34334 debug: Registering configuration section 'system' (System access section)
11:23:15.34334 info: Parsing and validating configuration file 'C:\Users\jroque\Downloads\ActiveTestManager\config.json'
11:23:15.34635 debug: Using the following configuration settings:
Logging:
  Console (Console):
    level='debug', specificLevelLock='false', label='AutomationController, format='${log.timestamp} ${log.level}: ${log.message}'
    timestamp='true', timestampFormat='YYYY-MM-DD HH:mm:ss.SSS', maxLength='0'
    colorize='true', colorizeMessage='true'
    applications='<All>'
  ControllersAndDrivers (File):
    level='debug', specificLevelLock='false', label='AutomationController, format='${log.timestamp} ${log.level}: ${log.message}'
    timestamp='true', timestampFormat='HH:mm:ss.SSSSS', maxLength='0'
    dirname='C:/Users/jroque/Downloads/ActiveTestManager/ConnectIoT/Logs/Instances/ControllerTest_FleetManager_CleanRoom/Controller', filename='AutomationController_%DATE%.log', options='mode=511, flags='a''
    datePattern='YYYY-MM-DD', maxSize='10m', maxFiles='30d', zippedArchive='false'
    applications='[AutomationController, Driver*]'
Controller:
  retryAttempts='30', sleepBetweenAttempts='1000' ms
  profilerSessionsLocation='C:\Users\jroque\AppData\Local\Temp\ConnectIoT\ProfilerSessions'
  monitorProcessCommunication: useSsl='false'
  driverProcessCommunication: useSsl='false'
System:
  tenantName='BBRAUN', loadBalancing='false', urlSuffix='undefined'
  address='localhost', port='903', ssl='false', timeout='120000 ms'
  authentication: type='Password'
    domain='cmf', user='jroque'
11:23:15.36236 debug: This application is not allowed to use this transport (ManagerAndMonitor)
11:23:15.36236 debug: This application is not allowed to use this transport (Jobs)
11:23:15.36236 warn: *** Minimum log entries set to 'debug' ***
11:23:15.36637 info: Starting NodeJS Controller with pid "30428".
11:23:15.36637 debug: Command line: _=[], id='AutomationControllerInstance/2310311623180000011', managerId='ActiveTestManager', manager-id='ActiveTestManager', componentId='Controller', component-id='Controller', serverHost='localhost', monitorPort=64211, mp=64211, monitor-port=64211, monitorHost='localhost', mh='localhost', monitor-host='localhost', monitorToken='monitorSecurityToken', mt='monitorSecurityToken', monitor-token='monitorSecurityToken', monitorSsl='false', config='C:\Users\jroque\Downloads\ActiveTestManager\config.json', dev='false', entityName='ControllerTest_FleetManager_CleanRoom', entity-name='ControllerTest_FleetManager_CleanRoom', port=13000, p=13000, $0='index.js'
11:23:15.36637 info:   ConfigurationFile='C:\Users\jroque\Downloads\ActiveTestManager\config.json'
11:23:15.36737 info: Using 'C:/Users/jroque/Downloads/ActiveTestManager/ConnectIoT/Persistency' for directory persistency storage. Retention time is '2592000' seconds
11:23:15.36737 info: Controller "AutomationControllerInstance/2310311623180000011" is booting...
11:23:15.36737 debug: Setting up MES system connection
11:23:15.36737 info: Setting up SystemAPI Rest communication
11:23:15.36737 debug: tenantName='BBRAUN', loadBalancing='false', address='localhost', port='903', ssl='false'
11:23:15.36737 info: Authenticating client...
11:23:15.36837 debug: Password Authenticate: domain='cmf', username='jroque'
11:23:15.46747 info: Authentication successful for user 'CMF\jroque'
11:23:15.47147 info: Setting up Monitor connection
11:23:15.47147 debug: Establishing connection with Monitor, reconnectInterval=1000, reconnectMaxAttempts=0, host='localhost', port=64211, securityToken='monitorSecurityToken', requireBuffering=true, bufferingId='AutomationControllerInstance/2310311623180000011'
11:23:15.47748 info: Connected with message bus!
11:23:15.47948 info: Connection with monitor established
11:23:15.47948 info: Connection with Monitor successfully established!
11:23:15.48048 debug: Executing query 'ControllerFromInstance' in System, over entity 'AutomationControllerInstance'
11:23:15.50350 info: Executed query, and received '1' results
11:23:17.54655 info: Adding workflow: Name='Setup', Id='2310311623180000702', LastServiceHistoryId='2310311623180044467'
11:23:17.55355 info: Requesting package location. Package='@criticalmanufacturing/connect-iot-controller-engine-core-tasks', Version='10.1.2-202309224'
11:23:17.55656 info: Requesting package location. Package='@criticalmanufacturing/connect-iot-controller-engine-opcua-tasks', Version='10.1.2-202309224'
11:23:17.55656 info: Package location retrieved. Package='@criticalmanufacturing/connect-iot-controller-engine-core-tasks', Version='10.1.2-202309224', Location='C:\Users\jroque\Downloads\ActiveTestManager\ConnectIoT\Cache\[email protected]'
11:23:18.21822 info: Package location retrieved. Package='@criticalmanufacturing/connect-iot-controller-engine-opcua-tasks', Version='10.1.2-202309224', Location='C:\Users\jroque\Downloads\ActiveTestManager\ConnectIoT\Cache\[email protected]'
11:23:18.82382 info: Adding workflow: Name='RequestTransport_Command', Id='2310311623180000713', LastServiceHistoryId='2310311623180044467'
11:23:18.82482 info: Requesting package location. Package='@criticalmanufacturing/connect-iot-controller-engine-factoryautomation-tasks', Version='10.1.2-202309224'
11:23:18.82783 info: Package location retrieved. Package='@criticalmanufacturing/connect-iot-controller-engine-factoryautomation-tasks', Version='10.1.2-202309224', Location='C:\Users\jroque\Downloads\ActiveTestManager\ConnectIoT\Cache\connect-iot-controller-engine-factoryautomation-tasks@10.1.2-202309224'
11:23:19.14314 info: [<<root>>|RequestTransport_Command|task_2804|codeExecution] Initializing Virtual Machine Engine version 1.0.0
11:23:19.17217 info: Adding workflow: Name='RequestReleaseOfNextAction_Command', Id='2310311623180000709', LastServiceHistoryId='2310311623180044467'
11:23:19.17518 info: Unsubscribing in 'Server' a previously registered subject
11:23:19.17518 info: Subscribing in 'Server' for messages of type 'connect.iot.driver.opcua.OnCommand.RequestReleaseOfNextAction'
11:23:19.17518 info: Adding workflow: Name='JobStatusUpdate_Command', Id='2310311623180000707', LastServiceHistoryId='2310311623180044467'
11:23:19.17818 info: Unsubscribing in 'Server' a previously registered subject
11:23:19.17818 info: [<<root>>|JobStatusUpdate_Command|task_4493|codeExecution] Initializing Virtual Machine Engine version 1.0.0
11:23:19.18519 info: Subscribing in 'Server' for messages of type 'connect.iot.driver.opcua.OnCommand.JobStatusUpdate'
11:23:19.18519 info: Controller 'AutomationControllerInstance/2310311623180000011' notifying monitor that is available. Pid='30428'
11:23:19.18719 info: Received entity information assigned to this process. Name='ControllerTest_FleetManager_CleanRoom', Type='Cmf.Navigo.BusinessObjects.Resource, Cmf.Navigo.BusinessObjects'
11:23:19.18819 info: Received connection information for "Server"
11:23:19.18819 debug: Details: type='websocket', host='localhost', port=64235, useSsl=false, securityToken='309f3390c5bf38dcba9c4c1764353621a579eb5b0a6183e09e93a2fd4d506083eec04e06241a62b910d65b7584288fa122cb314c1ce629ee34478d611255a92ccedf59de45d82b89d9ccd875062910c41530e82244a621eaae8259ac5942825babdaf2fef28f55177b1c9eaf6f2ae0939f04390fb6b4eb12a47f5ecc548934b69993cb2aedaafcad738a61b026ecff0b93142131d00de833cce4d50957aaaadc93fca8e942c304fe47fdcffb7ae2c0f7c15e3e37ec016e33778bfe41d6684ae90eeaf8dee4a247c1fd1ce374260678a5463fac42691099583f24025b17830381ac4ea1f4dea47132e9057f03b8994d6818460c2837f1bd4d16ad64833ba12842', $id='4'
11:23:19.18819 info: Received connection information for "Client"
11:23:19.18819 debug: Details: type='websocket', host='localhost', port=64234, useSsl=false, securityToken='fef4e74349ebb1f03a4ea7f7e73fbc7f8cf770d37ec71f31b1fe3bd63e1fb9bcfb9cdf33fff7c914aaecd034d606e47369321e2275ea4e244657fe97952e09a05c92358dbcf959f22cbf5c1440a1f9f1edf685e5dc3d17ccd9e39a5dccd91a1fd085ab1895420d51884e226ba5e5ca464d2b0e6c071eaf235b76aa216c9cc9b370c7a72bd661ff98d3fc9c492bcb3ebca712ec235d68834ee815ccb1567d5a2a52a38c8884680e8c95e31308720cd36058e62f08c098a8d440923af8245ba18659db4afd715f7fb661aac00f8c7021b30b8746b889b692d3c7191f32349bab5a6e4e80616a38f96f316c2f1d295ac2d0ecd90c27681b730468421831d1230f58', $id='4'
11:23:19.18919 info: Controller available notification was accepted
11:23:19.18919 debug: Updating 'AutomationControllerInstance/2310311623180000011' instance to 'Running'
11:23:19.28128 info: Updated 'AutomationControllerInstance/2310311623180000011' instance to 'Running'
11:23:19.28128 info: Controller process started with success
This log is a mirror to the monitor as some of the packages that were retrieved in the monitor were retrieved because the controller requested that it needed them. We also see the normal boot up with all the process configurations. There is the cycle of adding workflows and if those workflows require them, to generate subscriptions for particular types of messages.
Let’s take a look at an example of receiving a command execution for an OPC-UA Server and then replying:
15:09:33.896 info: [25689036|JobStatusUpdate_Command|task_3478|onCommand] Received Command for OPC-UA Server with id:'e61d71f3-c82b-4b53-8588-44febd241a16' and values: '[{"name":"TransportStatus","valueType":{"type":4},"editable":false,"removable":false},{"name":"SLCID","valueType":{"type":4},"editable":false,"removable":false},{"name":"AMRID","valueType":{"type":4},"editable":false,"removable":false}]'
15:09:33.903 debug: [25689036|JobStatusUpdate_Command|anyToConstant] Converted to constant value="0"
15:09:33.903 debug: [25689036|JobStatusUpdate_Command|anyToConstant] Converted to constant value="No Error"
15:09:33.922 debug: [25689036|JobStatusUpdate_Command|task_3479|commandResult] Sending command result for request with id e61d71f3-c82b-4b53-8588-44febd241a16.
15:09:33.922 info: Sending to 'Server' a message of type 'connect.iot.driver.opcua.CommandResult'
All this transaction works in the zone 25689036 zones zone.js. This id is very helpful to follow the transaction context throughout the logs. When the context is <root> it means no context was generated. We can see the name of the workflow page JobStatusUpdate_Command and the id and name of task task_3478|onCommand. Looking at the messages it’s apparent we received a command with an id and a payload id:'e61d71f3-c82b-4b53-8588-44febd241a16' and values: '[{"name":"TransportStatus","valueType":{"type":4},"editable":false,"removable":false},{"name":"SLCID","valueType":{"type":4},"editable":false,"removable":false},{"name":"AMRID","valueType":{"type":4},"editable":false,"removable":false}]'. Then we do some conversions of values and we reply back the command execution.
Automation Driver
The Automation Driver logs will describe the interface with a particular protocol.
14:21:20.04004 debug: Using file 'C:\Users\jroque\Downloads\ActiveTestManager\config.json' for configurations
14:21:20.04204 debug: Registering configuration section 'logging' (Logging section)
14:21:20.04204 debug: Registering configuration section 'driver' (Driver Section)
14:21:20.04204 debug: Registering configuration section 'driver/processCommunication' (Process communication with Controller (from driver))
14:21:20.04204 debug: Registering configuration section 'monitor/processCommunication' (Process communication with Monitor)
14:21:20.04204 info: Parsing and validating configuration file 'C:\Users\jroque\Downloads\ActiveTestManager\config.json'
14:21:20.04404 debug: Using the following configuration settings:
Logging:
  Console (Console):
    level='debug', specificLevelLock='false', label='DriverOpcUA, format='${log.timestamp} ${log.level}: ${log.message}'
    timestamp='true', timestampFormat='YYYY-MM-DD HH:mm:ss.SSS', maxLength='0'
    colorize='true', colorizeMessage='true'
    applications='<All>'
  ControllersAndDrivers (File):
    level='debug', specificLevelLock='false', label='DriverOpcUA, format='${log.timestamp} ${log.level}: ${log.message}'
    timestamp='true', timestampFormat='HH:mm:ss.SSSSS', maxLength='0'
    dirname='C:/Users/jroque/Downloads/ActiveTestManager/ConnectIoT/Logs/Instances/ControllerTest_FleetManager_CleanRoom/Server', filename='DriverOpcUA_%DATE%.log', options='mode=511, flags='a''
    datePattern='YYYY-MM-DD', maxSize='10m', maxFiles='30d', zippedArchive='false'
    applications='[AutomationController, Driver*]'
Driver(s):
  retryAttempts='30', sleepBetweenAttempts='1000' ms
  processCommunication: useSsl='false'
  monitorProcessCommunication: useSsl='false'
14:21:20.06306 debug: This application is not allowed to use this transport (ManagerAndMonitor)
14:21:20.06306 debug: This application is not allowed to use this transport (Jobs)
14:21:20.06306 warn: *** Minimum log entries set to 'debug' ***
14:21:20.06306 info: Starting OPC UA driver with pid "21624".
14:21:20.06406 debug: Command line: _=[], id='AutomationDriverInstance/2310311623180000032', managerId='ActiveTestManager', manager-id='ActiveTestManager', componentId='Server', component-id='Server', serverHost='localhost', sh='localhost', server-host='localhost', monitorPort=49371, mp=49371, monitor-port=49371, monitorHost='localhost', mh='localhost', monitor-host='localhost', monitorToken='monitorSecurityToken', mt='monitorSecurityToken', monitor-token='monitorSecurityToken', monitorSsl='false', config='C:\Users\jroque\Downloads\ActiveTestManager\config.json', dev='false', entityName='ControllerTest_FleetManager_CleanRoom', entity-name='ControllerTest_FleetManager_CleanRoom', inspect-brk=true, inspectBrk=true, serverPort=0, sp=0, server-port=0, $0='index.js'
14:21:20.06406 info:   ConfigurationFile='C:\Users\jroque\Downloads\ActiveTestManager\config.json'
14:21:20.06807 info: Driver "AutomationDriverInstance/2310311623180000032" is booting...
14:21:20.06907 info: Setting up Monitor connection
14:21:20.06907 debug: Establishing connection with Monitor, reconnectInterval=1000, host='localhost', port=49371, securityToken='monitorSecurityToken',
14:21:20.09009 info: Connection with monitor established
14:21:20.09109 info: Connection with Monitor successfully established!
14:21:20.10410 debug: Trying to read control persistency data from "C:\Users\jroque\Downloads\ActiveTestManager\ConnectIoT\Persistency\OPCUA_Server\AutomationDriverInstance_2310311623180000032\connectIoT_ControlFile.json"
14:21:20.10410 debug: No store was found
14:21:20.10410 info: Using port "49380" to communicate with controller
14:21:20.10410 info: Notifying communication details to allow connection with controller
14:21:20.10511 debug:   ConnectionInformation: type='websocket', host='localhost', port=49380, useSsl=false, securityToken='d5f6cdd28ecd535a221788046e56cd3989c3ea5db5a6399fbf098d871adc970369552b9d00cf16504461b868686cf921092ad59ffee3ccb3a56eb94911890d2a131ec25b0955db512f4cb741c62d209fa06a660ffa9698b8500d0fea46e33b03a9a9ced788eb34fee914fa923c8c2c66410c6a2d2f37f47efd056db945c24b76205fe1b125f2c976d1ade54bb4dbea016cb80bf83ee2f6f199274a0a8aad236a99574360154028d583e94c1e9a95c61b054cd268fbd7cadc58204a24ac52cfe96428f90a9f8e5b3e2c4e6e224f29bda81530a0b4ada244c1bf7cd9e078cb418604ce63f045cf31bfce4f8e2eb12434f069a1756bd7050465eb3cb74bb74c8cb6'
14:21:20.11311 info: Received entity information assigned to this process. Name='ControllerTest_FleetManager_CleanRoom', Type='Cmf.Navigo.BusinessObjects.Resource, Cmf.Navigo.BusinessObjects'
14:21:20.11411 info: Communication details notification was accepted
14:21:20.11411 info: OPC UA Driver process started with success
14:21:25.70070 debug: Client Connected! from 49967. Have now 1 clients.
14:21:25.71471 info: Configuring device based on configuration received
14:21:25.71872 debug: Managing certificates
14:21:25.71972 debug: Certificates folder: C:\Users\jroque\AppData\Local\Temp\ConnectIoT\OPC-UA\Certificates\AutomationDriverInstance_2310311623180000032
14:21:25.71972 debug: No certificate/public key define, using default generated.
14:21:25.94194 debug: Added custom data types
14:21:26.18819 info: Configuring device based on configuration received
14:21:26.18919 debug: Managing certificates
14:21:26.19019 debug: Certificates folder: C:\Users\jroque\AppData\Local\Temp\ConnectIoT\OPC-UA\Certificates\AutomationDriverInstance_2310311623180000032
14:21:26.19019 debug: No certificate/public key define, using default generated.
14:21:26.19319 info: Connecting device
14:21:26.19419 info: Creating OPCUA server
14:21:26.19620 info: Communication state changed Unknown -> Connecting
14:21:26.19720 info: Initializing OPCUA server
14:21:27.14414 info: Starting OPCUA server
14:21:27.14715 info: Server listening on 'opc.tcp://127.0.0.1:6020'
14:21:27.14715 info: Communication state changed Connecting -> Setup
14:21:27.14715 info: Device connected and ready to be setup
14:21:27.17618 info: Reporting Setup Result (success='true')
14:21:27.17618 info: Device successfully setup
14:21:27.17618 info: Communication state changed Setup -> Communicating
Very similar to the controller there is a boot up cycle. Interesting things that we see is that we have a persistency being retrieved for the driver, also that this driver uses certificates and that is listening on opc.tcp://127.0.0.1:6020.
Note: All drivers are different and log different things, in this case it is a Server as such it informs where the server is hosting.
Notice that it connects to the Monitor application and also to the controller. The connection via websocket to the controller is how we will notify it of new information (i.e events).
14:22:05.43544 info: Received a Command Execution for 'JobStatusUpdate' with id:'8ee8ad50-314c-4c31-a0a1-cc9437a14ea1' with command parameters '{"TransportStatus":"Completed","SLCID":"test","AMRID":"asdas"}'
14:22:05.43544 debug: Notify connect.iot.driver.opcua.OnCommand.JobStatusUpdate for 'JobStatusUpdate' with command params '{"TransportStatus":"Completed","SLCID":"test","AMRID":"asdas"}'
14:22:18.31932 debug: Heartbeat received from Monitor
14:22:27.19720 info: Getting values for properties: JobStatusUpdate-HServiceType
14:22:28.11500 info: Replying to command with id '8ee8ad50-314c-4c31-a0a1-cc9437a14ea1' with outputs: [{"dataType":5,"value":0,"arrayType":0},{"dataType":12,"value":"No Error","arrayType":0}]
In this log we see that there was a command execution in the OPC-UA server. The command was the JobStatusUpdate and it was sent with the parameters {"TransportStatus":"Completed","SLCID":"test","AMRID":"asdas"}. Then we see this request being forwarded to the controller. We get a request and we answer with a reply for the same id 8ee8ad50-314c-4c31-a0a1-cc9437a14ea1.
Pretty simple, right. Let’s look at the workflow to see if it matches.
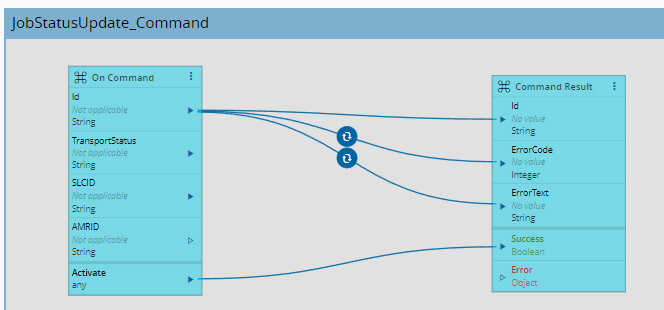
All in all, we just receive a request and reply with a constant set of values. But you already new this, as we already took that trip through the logs!!!
Author
Hello 👏 , my name is João Roque ✌️
I’ve been working for some years at Critical Manufacturing. I split my time working in the IoT Team and working with the project’s teams. You can visit me at https://j-roque.com/ or check me at LinkedIn
Skills: Connect IoT / DevOps