This will be a how to, on debugging the code task.
Topics
- Overview
- How To
Overview
With the introduction of the code task, the need of customization has decreased substantially. Some of the complexity of customization has shifted to the code task. In software development, visibility and transparency on what is happening is essential, to better understand if the work fits the requirements and does not have undesirable side effects.
How To
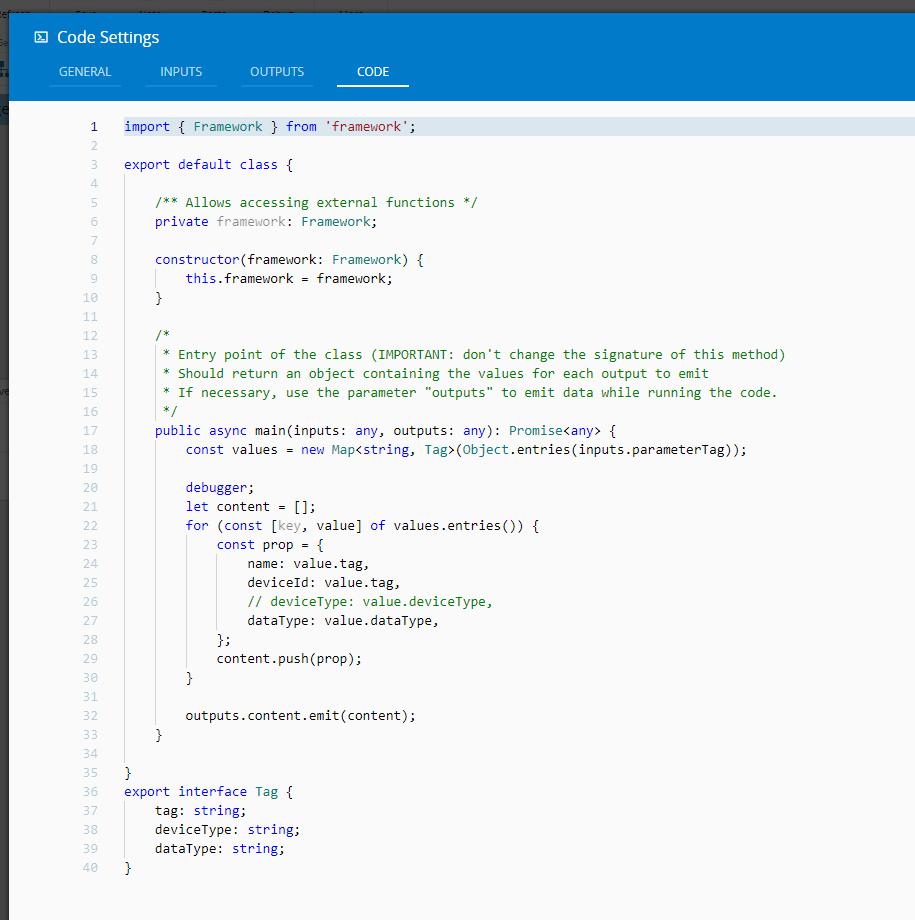
Using the visual studio code as administrator we will debug the code task. In the code task add a hook debugger; this hook will provide a breakpoint for the appended execution of the visual studio code debugger to stop.
Start the Automation Manager and open visual studio code and select F1. After selecting F1 a dropdown will appear, in this case we want to append to a node process, so select Debug: Attach to Node Process. It will show several node processes, the automation manager spawns at least 3 processes, one for the monitor, other for the driver and another for the controller. The code task is executed by the controller process, so that is the one we want to attach.

Now, whenever the code task is invoked it will stop in VS Code.
Author
Hello 👏 , my name is João Roque ✌️
I’ve been working for some years at Critical Manufacturing. I split my time working in the IoT Team and working with the project’s teams. You can visit me at https://j-roque.com/ or check me at LinkedIn
Skills: Connect IoT / DevOps